
Decoded

Yating Shi, left, performs a flow-mediated dilation (FMD) test on Bingjie Zhou as Johannas Shiyi Li looks on.
All three are doctoral students in Dr. Qianhong Wu’s lab.
Nine years ago, Penn ultrasound expert Chandra Sehgal, PhD, suspected a curve held more information than its peak. He turned to Villanova Professor and Chair of Mechanical Engineering Qianhong Wu, PhD, with a question: What does the waveform mean?
That question grew from flow-mediated dilation, or FMD, a noninvasive test long used to gauge vascular health. A pressure cuff squeezes the arm, cutting off blood flow. When the cuff releases, blood rushes back, and an ultrasound records the artery widening. A weak response signals what clinicians call endothelial dysfunction: The artery’s inner lining isn’t working as it should. That can warn of cardiovascular disease long before symptoms appear.
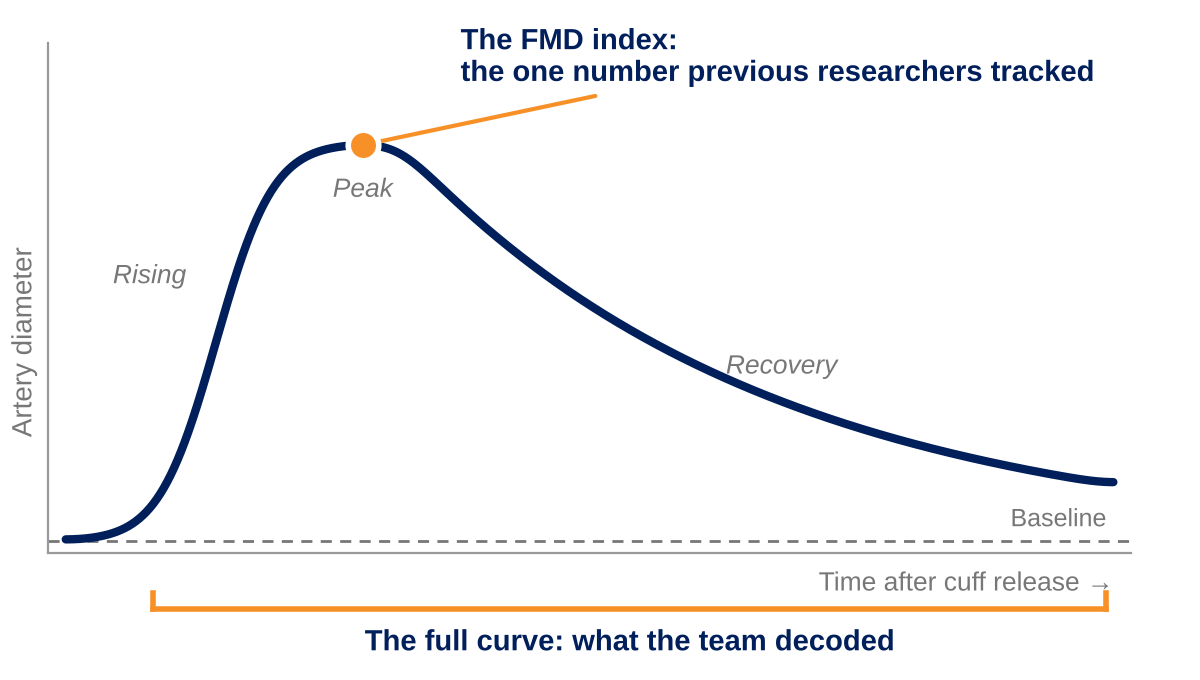
For decades, researchers tracked one number: the FMD index—how much the artery widened at its peak, as a percentage of its starting size. It was easy to calculate.
But the response is really a curve. Plot the artery’s diameter in the minutes after the cuff is released, and it rises, peaks and slowly settles. The FMD index captures only one point on the curve: the peak.
The curve was harder to explain.
More Than a Measurement
Where others saw a number, Dr. Wu saw a physics problem: a fluid-structure interaction. Flowing blood shapes the artery wall. The artery wall shapes the flow.
The wall is alive. As Dr. Wu puts it: “Its cells sense the rushing blood, adapt and reshape the forces acting on them. The body doesn’t just react to change. The body helps create it.”
But what does the curve mean?
Engineering the Answer
No single field could crack the code. It would take an interdisciplinary team, and something the field lacked: a mathematical framework that traces how rushing blood signals the artery wall to widen.
Dr. Sehgal brought imaging expertise; Dr. Wu, fluid mechanics and biomechanics. Sridhar Santhanam, PhD, vice dean of Villanova’s College of Engineering and professor of Mechanical Engineering, added solid mechanics modeling and simulation. Bchara Sidnawi, PhD, then Dr. Wu’s doctoral student, spent years building the framework.
The goal was not to create a better number. It was to decode the curve.
What the Curve Revealed
The model grew more sophisticated. Lab data shaped the physics. The physics raised new questions. The questions sent the team back to the lab.
Gradually, the curve began to make sense.
The framework revealed the physics behind it, tying together blood flow, vessel mechanics and cellular signaling. It also explained features beyond the peak that researchers had seen for years but never fully understood.
From those equations, Dr. Sidnawi and Dr. Wu derived five biophysical markers, the heart of Dr. Sidnawi’s dissertation. Together, the markers describe:
- How stiff the artery wall is
- How readily it softens
- How strongly it senses rushing blood
- How well it recovers
- How quickly it adapts
The FMD index alone can’t measure any of them.
The team’s work led to a series of journal articles and a U.S. patent. Dr. Sidnawi earned his PhD in 2024 and joined Temple University’s faculty
Its cells sense the rushing blood, adapt and reshape the forces acting on them. The body doesn’t just react to change. The body helps create it.
”- Qianhong Wu, Professor and Chair of Mechanical Engineering
The Next Chapter
The curve still has more to say.
Today, the Villanova team is testing those five markers: Can they sharpen diagnosis and, one day, inform treatment? Because FMD relies on ultrasound, a common, inexpensive clinical tool, the framework could integrate into existing systems.
Five more institutions now contribute patient and waveform data. Villanova doctoral student Bingjie Zhou is examining whether the markers strengthen FMD’s diagnostic power, using records from collaborators at Augusta University, the University of Miami and Indiana University. In one study, the artery walls of people with Type 1 diabetes sensed rushing blood less strongly than those of healthy participants, a difference the FMD index alone missed.
Doctoral student Yating Shi is investigating whether individual markers correlate with specific biochemical pathways. Confirmed correlations could help guide targeted drug therapies. The work is a collaboration with Assistant Professor Laura Bracaglia, PhD, and her doctoral student Jay Jianlei Wu, of Villanova’s Chemical and Biomedical Engineering Department.
Doctoral student Johannas Shiyi Li, new to Dr. Wu’s group, is extending the framework to everyday clinics, where most tests capture only part of the curve. Li is training AI on complete curves to find clues hidden in partial ones—clues that could help detect cardiovascular disease early, in many more patients.
Nine years ago, an ultrasound expert asked an engineer what the curve meant. One generation decoded it. The next is translating the curve into care.
Related Research
U.S. Patent No. 12,640,266
Diagnostic Tool for Analyzing Results of Flow Mediated Dilation
Qianhong Wu, Sridhar Santhanam, Bchara Sidnawi, and Chandra M. Sehgal. Issued May 26, 2026.
Feature Article
A comprehensive physics-based model for the brachial artery’s full flow mediated dilation (FMD) response observed during the FMD test.
Bchara Sidnawi, Bingjie Zhou, Zhen Chen, Chandra Sehgal, Sridhar Santhanam, and Qianhong Wu. Computers in Biology and Medicine, 2024.
Earlier Work by Bchara Sidnawi, Qianhong Wu and colleagues
The papers that built the framework, 2019–2022:
- On the examination of the viscous response of the brachial artery during flow-mediated dilation. Journal of the Mechanical Behavior of Biomedical Materials, 2022.
- On the modeling of mechanotransduction in flow-mediated dilation. Journal of the Mechanical Behavior of Biomedical Materials, 2021.
- Characterization of flow mediated dilation via a physics-based model. Journal of the Mechanical Behavior of Biomedical Materials, 2020.
- Characterization of blood velocity in arteries using a combined analytical and Doppler imaging approach. Physical Review Fluids, 2019.